Rebuilding a Retail Data Platform Without Moving the Numbers
How we rebuilt the data platform of a US retail-commerce company and held net sales to -0.007% on $85M a month: four-grain reconciliation and cut-over.
You rebuild a data platform without breaking trusted numbers by reconciling the old and new systems at every grain, from the platform total down to single transactions, and by giving every difference a named cause before anyone sees the new dashboard. On a core data platform rebuild for a fast-scaling US retail-commerce platform, that process held net sales to -0.007% of the legacy figure across about $85M of monthly revenue, and every company with more than $1M in sales matched within 0.1%.
This is how we did it, including the bugs we found on both sides.
What was being rebuilt, and why did the numbers matter so much?
The platform runs point-of-sale and e-commerce for around 400 US retail businesses. Those businesses read their daily sales, margins and staff performance from dashboards embedded in the product. Some of them keep their own copies of daily sales reports going back years and compare them against what the product shows. If a number moves by a cent, someone notices.
The legacy warehouse was PostgreSQL. Scheduled SQL jobs read the operational MongoDB database and recomputed sales tables, and a lot of business logic lived inside those jobs: tax and cost were allocated from transaction level down to line level with formulas in the warehouse.
The new platform extracts MongoDB collections to Parquet on S3, loads them into Amazon Redshift, and models them with dbt through four layers (archive, staging, intermediate, core facts and dimensions). The BI tool stayed the same: Amazon QuickSight. One principle drove the design: the warehouse does not recalculate what the source system already calculated. It sums and joins. It doesn't re-derive tax.
The first scope was deliberately narrow: two dashboards, Sales Summary and Employee Sales. Same 13 visuals, same parameters, new data underneath.
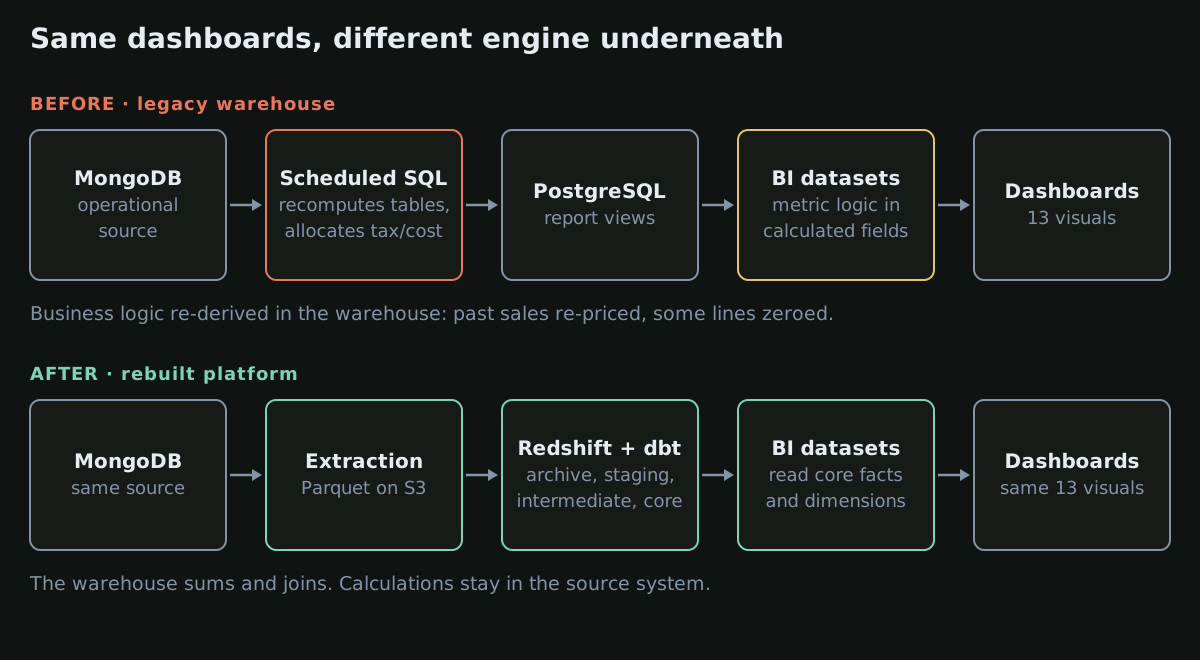 Before and after: legacy cron-recomputed Postgres tables versus a layered dbt model on Redshift, with the same QuickSight dashboards on top.
How do you prove two data platforms agree?
We compared the two systems at four grains, because each grain finds a different kind of problem:
- Platform total (all US, 2025 and 2026). Tells you whether you are close. Doesn't tell you why.
- Company (all 400). Catches problems that cancel out in aggregate.
- Shop. The biggest shop-level gap was $35 over a year.
- Transaction. This is where causes live. Sorting the transaction-level difference column from largest to smallest is the most useful thing you can do in a migration.
For the dashboards themselves, we went visual by visual and formula by formula: what each tile computes in the legacy dataset, what it computes in the new one, and the live difference.
The per-company check was a plain comparison of two extracts over the same window and the same status rule:
-- Same window, same status rule, one row per company
SELECT
  COALESCE(l.company_id, n.company_id)            AS company_id,
  l.net_sales                                     AS legacy_net_sales,
  n.net_sales                                     AS new_net_sales,
  n.net_sales - l.net_sales                       AS delta,
  (n.net_sales - l.net_sales) / NULLIF(l.net_sales, 0) AS delta_pct,
  n.txns - l.txns                                 AS delta_txns
FROM legacy_by_company l
FULL OUTER JOIN new_by_company n USING (company_id)
ORDER BY ABS(n.net_sales - l.net_sales) DESC;
The FULL OUTER JOIN matters. One company existed only on the new side, and an inner join would have hidden it.
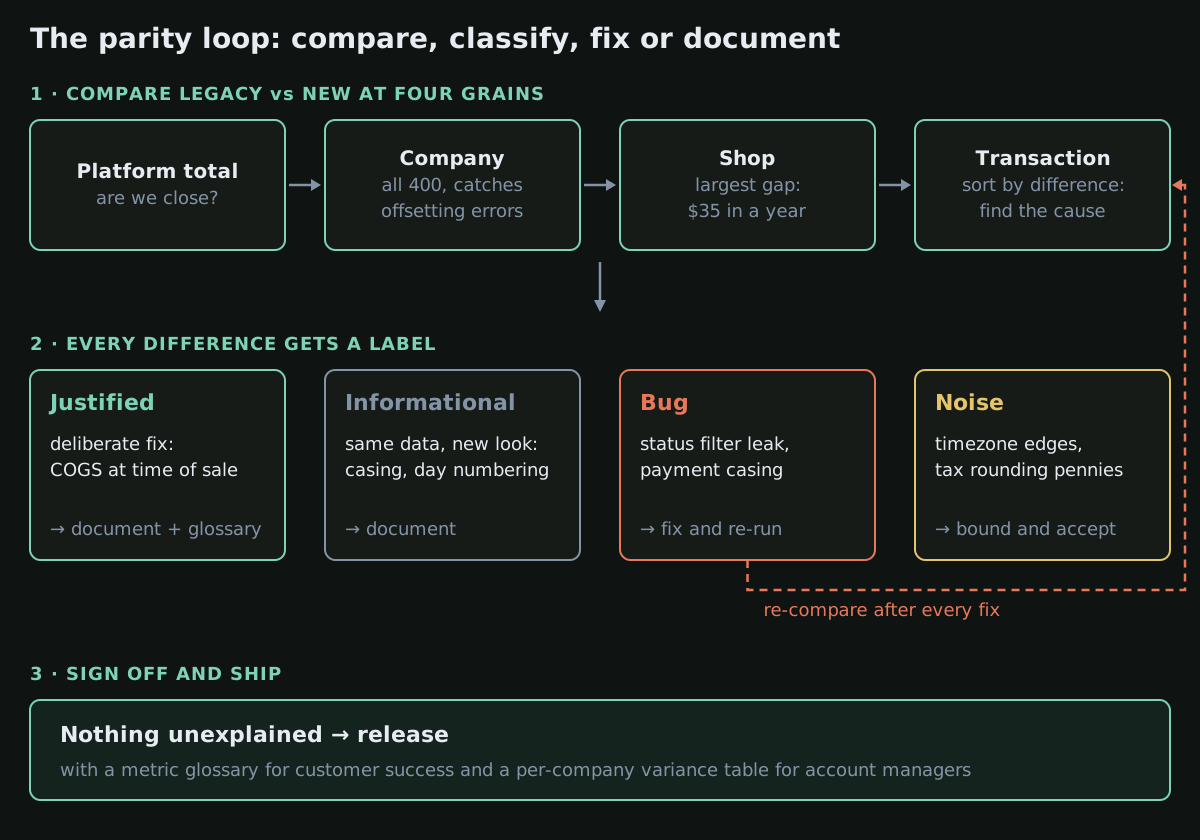 The reconciliation loop: compare at four grains, classify every difference into one of four buckets, fix or document, and only sign off when nothing is unexplained.
Every difference gets a label
The rule was simple: no difference ships as "unexplained". Each one went into one of four buckets:
- Justified. We changed the definition on purpose because the old one was wrong. Communicate it.
- Informational. Same data, different presentation. Document it.
- Bug. Fix it before release.
- Noise. Explained, bounded and below anything an operator would see on a tile. Accept it.
That labelling is what made the sign-off meeting short. Nobody was asked to trust a number; they were shown the reason for each gap.
What did the reconciliation actually find?
A dashboard filter that let phantom orders in. The new dashboard excluded only cancelled orders, so orders on hold, in progress or pending leaked into the KPIs: around 650 transactions and under $40,000 of net sales a month. Cancelled orders were also being netted into the total, which made March read about 2.8% low. The fix was an include-list (Completed, Refunded) that matches the legacy upstream filter exactly. The core fact table still holds every status; only the dashboard filters. Dashboards that legitimately need cancelled or pending orders are unaffected.
One payment method showing as two pie slices. Raw values came from MongoDB with inconsistent casing, so the same method appeared in upper and title case. The fix was a dbt seed mapping each raw key to one display value, joined case-insensitively. The review added a follow-up: unique and not_null tests on the seed, so a future row cannot silently break the join.
Timezone boundaries. On one sample day, 12 transactions appeared in the new platform but not the old, and one the other way round: transactions near local midnight landed on different days. That accounts for most of the sub-0.01% drift.
Tax rounding pennies. At transaction level we found many one-cent differences. The source platform stores line-level tax to four decimal places, sums, then rounds, instead of rounding each line first. Across 2025 and 2026 that came to 0.0014%–0.0018%, a few thousand dollars on over $250M of net sales. We did not patch it in the warehouse. The fix belongs in the source system, and the product team took it on.
A bug in the legacy warehouse. Six transactions were wrong in the old system: an allocation ratio evaluated to zero and wiped out part of the line. The new platform shows them correctly. Four of those six sat in one long-standing customer's historical reports.
Cost of goods sold. The legacy jobs priced past sales at today's product cost, so last month's margin changed every time someone edited a cost. The new model locks cost at the moment of sale. That moved March COGS by -0.087%. For one company, COGS moved 28.8% while its net sales stayed within 0.05%, which is how we confirmed the change was isolated to cost and nothing else.
New Members up 333%. The old metric counted members on their first purchase day; the new one counts sign-ups, including people who register and never buy. A 333% jump that is correct still has to be explained before anyone sees it.
What did parity look like at the end?
| Cut | Scale | New vs legacy |
|---|---|---|
| Net sales, March 2026 | about $85M | -0.007% |
| Net sales, Jan–Apr 2026 | over $300M | -0.024% |
| Transactions, March 2026 | about 1.9M | -0.006% |
| Total due, March 2026 | over $100M | -0.007% |
At company level the median difference was 0.012% and the 95th percentile 0.117%. Every company above $1M in net sales matched within 0.1%, and the three largest companies within 0.022%. Only four of 400 were off by more than 0.5%, and three of those had under $3,000 of sales in four months, where a single transaction crossing midnight swings the percentage.
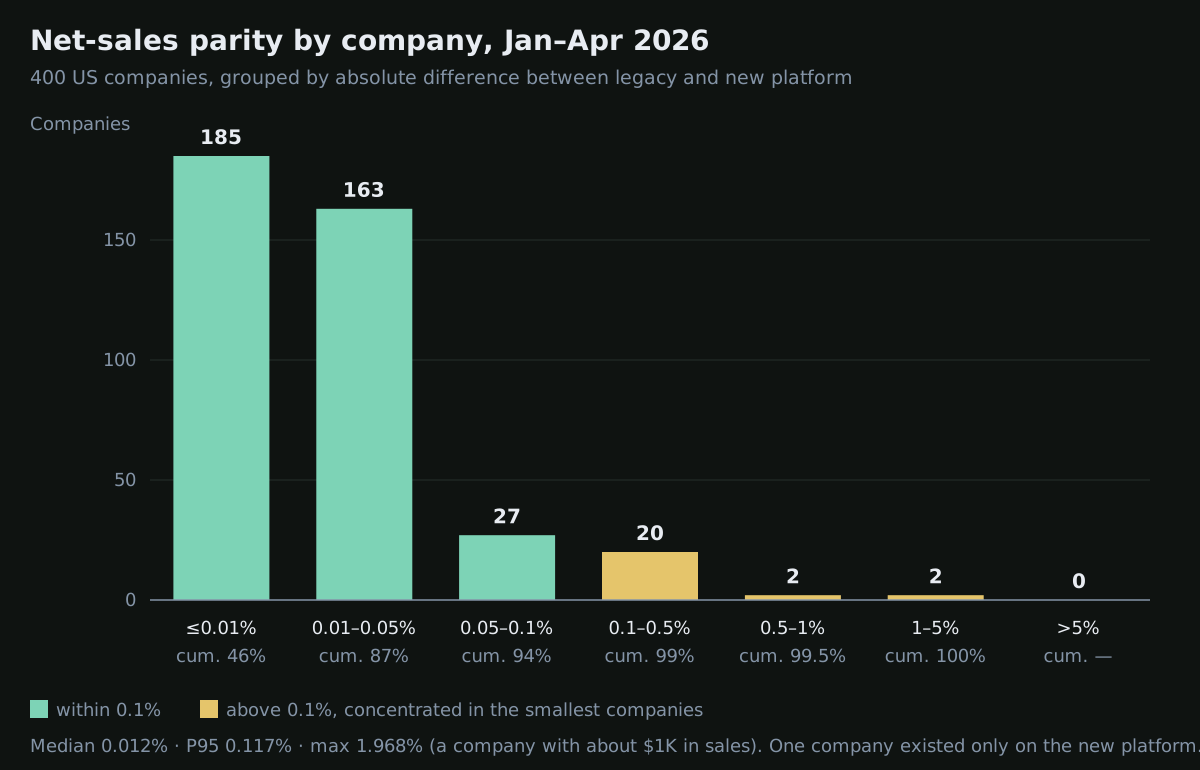 Distribution of the 400 companies by absolute net-sales difference, January to April 2026: 348 within 0.05%, none above 5%.
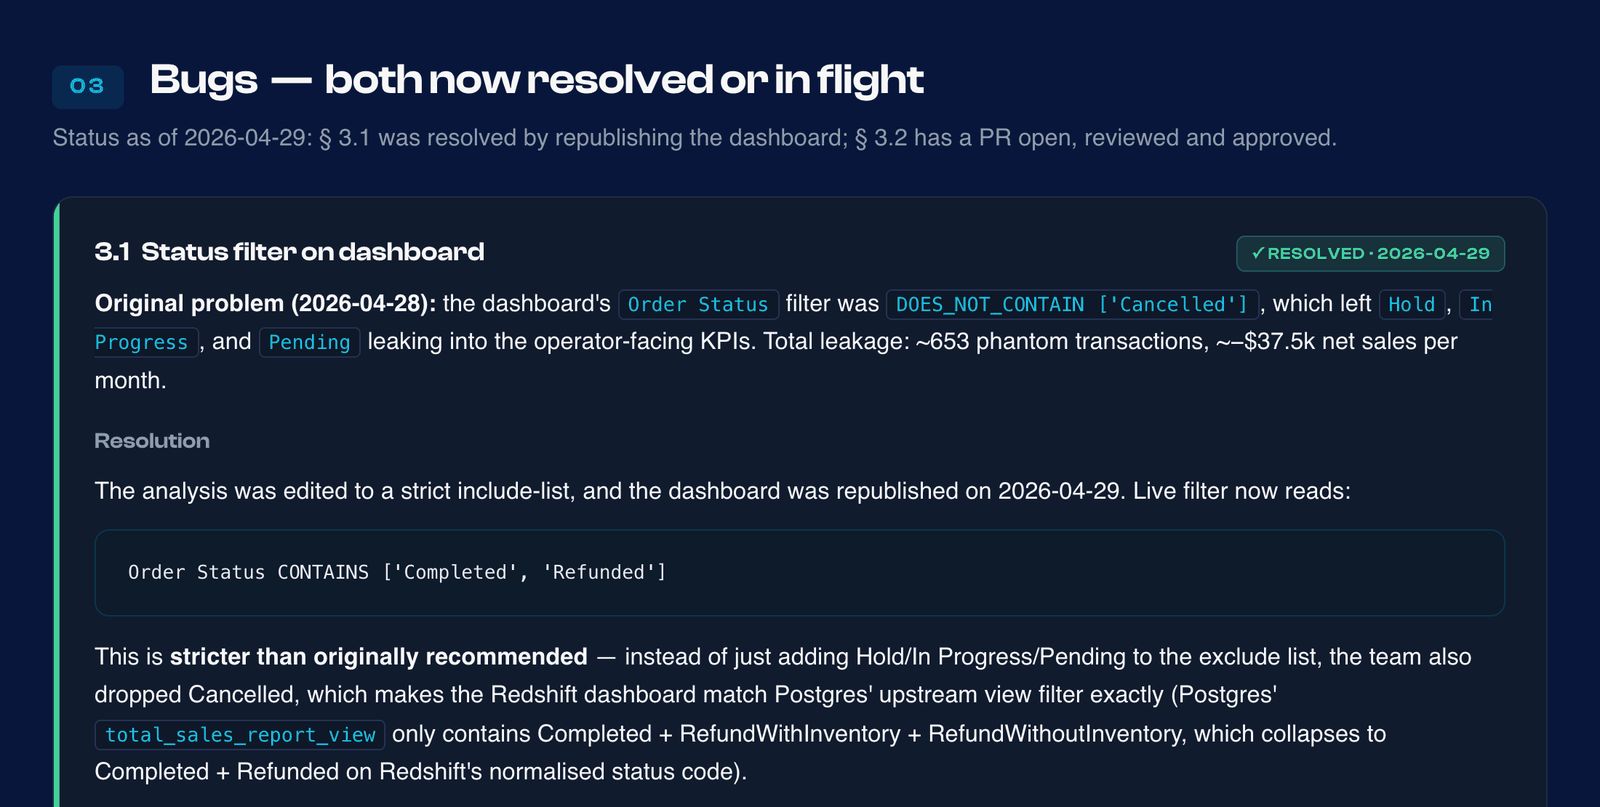 From the parity report: one of the bugs the reconciliation caught, a dashboard filter that let on-hold and in-progress orders into the headline KPIs. Client details removed.
How did the cut-over work?
We shipped the two dashboards while the legacy warehouse kept running. The decision meeting with the product lead and the account management team was 36 minutes: the differences were explained, the tax fix was assigned to the platform team, and the release went ahead with penny differences documented rather than blocking.
Three things went out with it:
- A one-page glossary for customer success: every metric and dimension on the two dashboards, how it is calculated, and the four definitions that changed (COGS at time of sale, New Members as sign-ups, case-normalised product types, the two refund statuses merged into one).
- A per-company variance table, so account managers could quote the exact difference for any customer before the customer asked.
- A plain announcement: same dashboards, same KPIs, same filters, same numbers, with four intentional changes listed.
The rest of the legacy estate (reports, exports and scheduled emails) is moving in tiers ranked by measured usage, so the items most people rely on move first.
What was hard?
The baseline was wrong in places. Parity with a system that reprices past sales and zeroes some lines is not the goal. The goal is that every gap is either closed or explained, and the explanation shows the new number is the right one.
The definitions lived inside BI datasets, not in code. Every metric was a calculated field in a QuickSight dataset: not versioned, not tested, not reusable. When we later rebuilt the Sales Summary metrics in a semantic layer, we got 3 of 8 definitions wrong from the documentation and only caught them by reading the live analysis. That is why the next phase puts the metric definitions in dbt.
The temptation to fix things in the warehouse. Patching tax rounding in SQL would have closed the penny gap faster, and it would have recreated the exact drift the rebuild was meant to remove. We sent it upstream.
Small percentages still matter to the customer. 0.0014% is noise to an engineer. To a business that has filed taxes on those numbers it is a question, and account managers need the answer in hand before it is asked.
What would we keep for the next migration?
- Reconcile at four grains, and always sort the transaction-level differences.
- Use full outer joins, so records that exist on only one side show up.
- Put every difference in a bucket: justified, informational, bug or noise. Nothing ships unexplained.
- Keep the model complete and filter in the presentation layer.
- Fix source-system problems at the source.
- Hand the people who face customers the per-account numbers and the glossary before launch.
If you are planning a rebuild of your own, the Foundations framework describes how we structure this work, and the diagnostic below tells you where to start.

Written by
Paulo Fernandes
Senior Data Engineer
Designs and delivers modern cloud-based data platforms using AWS, Terraform, and open-source orchestration. Builds automated pipelines, self-service infrastructure, and AI-enabled interfaces. Trusted by international clients to ship secure, scalable, and cost-optimized systems.
LINKEDIN →FAQ
Common questions
What is an acceptable parity threshold when migrating a data warehouse?
There is no universal number; the real bar is that every difference is explained. On this rebuild, net sales landed within -0.007% of the legacy figure for the month and every company with more than $1M in sales matched within 0.1%, with the remaining drift traced to timezone boundaries and tax rounding.
Should the new platform reproduce the old numbers exactly, including their bugs?
No. Reproduce what was right, fix what was wrong, and document each deliberate change before users see it. Here the new platform changed four definitions on purpose, including cost of goods sold, and each one was in a glossary for the customer success team on launch day.
How long does a dashboard-level parity check take?
For the first two dashboards on this programme, the formula-by-formula and company-by-company reconciliation ran as a set of reproducible queries over a four-month window, and the sign-off meeting took 36 minutes because every difference already had a named cause.
Planning a platform rebuild?
Run the 9-question AI Readiness Diagnostic and get a deterministic recommendation: Clarity, Foundations, or CORE.
Take the Diagnostic